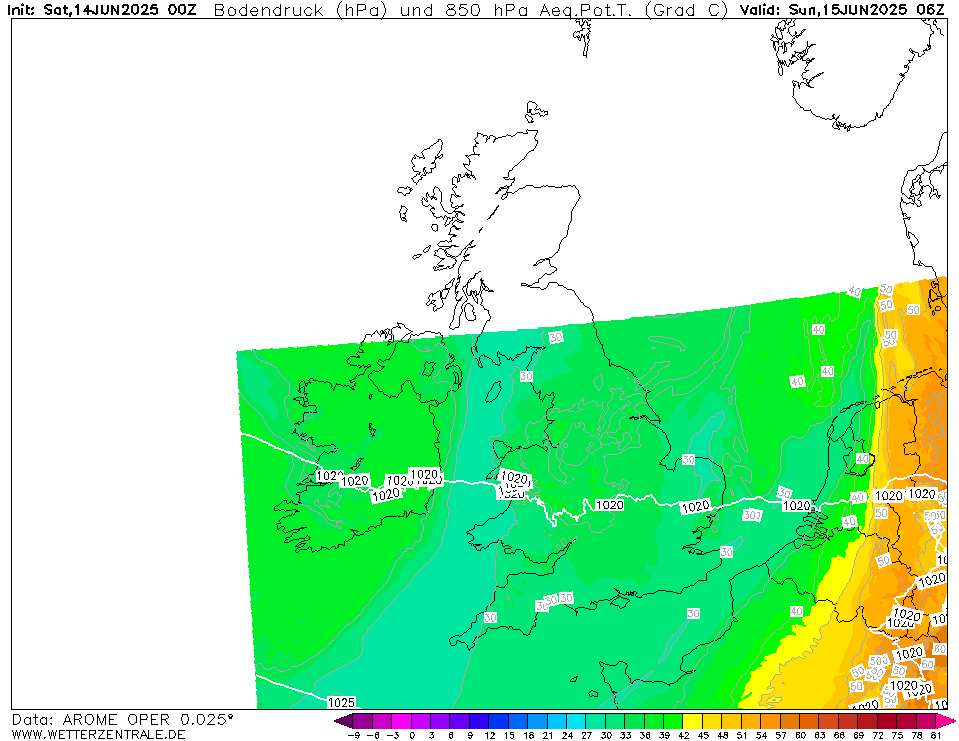
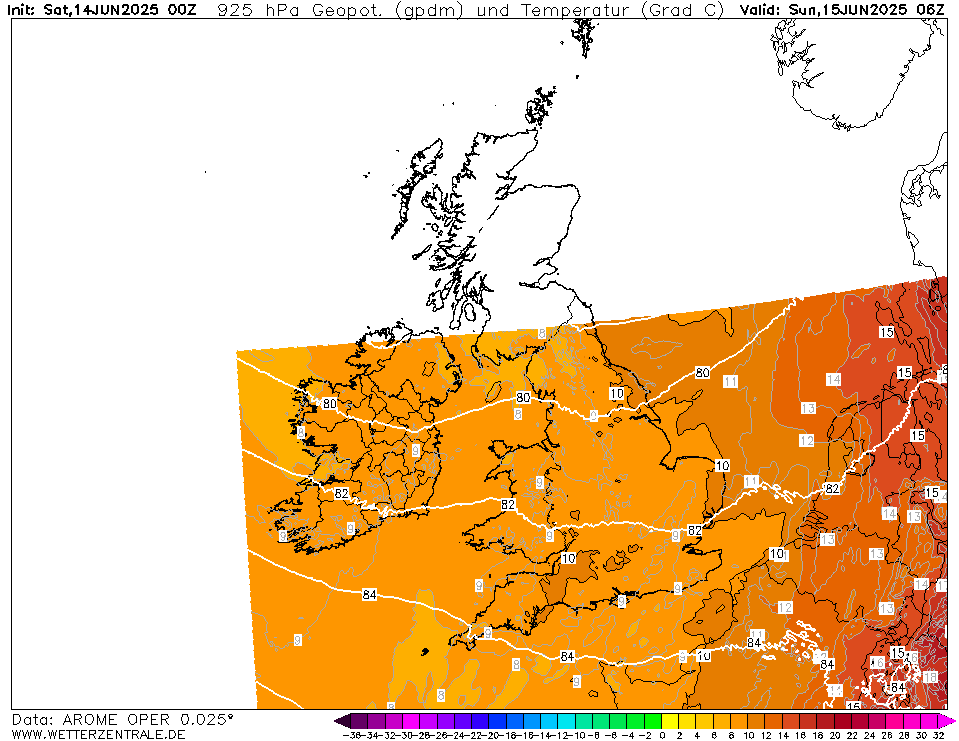
AROMECurrently selected. AROME is a high resolution (2.5 km) weather forecast model which is used by various weather services in Europe. On the WZ, forecasts from Meteo France and the Norwegian Weather Service are shown for western Europe and northern Europe, respectively.
ARPEGEThe selected time, variable and region is available for this model. ARPEGE is the global forecast model of the French weather service (Meteo France). It is runs with a maximum resolution of approx. 7 km in Europe and mean global grid spacing of 15 km. WZ offers forecasts up to 102 hours.
GFSThe selected time, variable and region is available for this model. GFS is the global weather forecast model of the US weather service run at an internal resolution of 28 km. It offers a plethora of parameters for the next 15 days. Updated 4 times a day up to 384 hours ahead. The runs for the 0, 6, 12 and 18Z runs are usually coming in from 3:30, 9:30, 15:30 and 21:30 UTC, respectively.
HARMONIE (KNMI-EU)The selected time, variable and region is available for this model. HARMONIE is developed in a european consortium and this is the output provided by the KNMI at the supercomputing facilities in Iceland. The output from Cy43 is available at a rotated lat-lon grid and regridded at our server to a grid spacing of 0.05 degree. These data are the raw data provided by the KNMI. The model is reinitialized every hour and run up to 60 hrs ahead.
IRIEThe selected time, variable and region is available for this model.
JMAThe selected time, variable and region is available for this model. The global weather forecast model of the Japanese weather service offers data up to 7 days into the future.


Member:
OP 1Tue 08 Jul 01:00
2Tue 08 Jul 02:00
3Tue 08 Jul 03:00
4Tue 08 Jul 04:00
5Tue 08 Jul 05:00
6Tue 08 Jul 06:00
7Tue 08 Jul 07:00
8Tue 08 Jul 08:00
9Tue 08 Jul 09:00
10Tue 08 Jul 10:00
11Tue 08 Jul 11:00
12Tue 08 Jul 12:00
13Tue 08 Jul 13:00
14Tue 08 Jul 14:00
15Tue 08 Jul 15:00
16Tue 08 Jul 16:00
17Tue 08 Jul 17:00
18Tue 08 Jul 18:00
19Tue 08 Jul 19:00
20Tue 08 Jul 20:00
21Tue 08 Jul 21:00
22Tue 08 Jul 22:00
23Tue 08 Jul 23:00
24Wed 09 Jul 00:00
25Wed 09 Jul 01:00
26Wed 09 Jul 02:00
27Wed 09 Jul 03:00
28Wed 09 Jul 04:00
29Wed 09 Jul 05:00
30Wed 09 Jul 06:00
31Wed 09 Jul 07:00
32Wed 09 Jul 08:00
33Wed 09 Jul 09:00
34Wed 09 Jul 10:00
35Wed 09 Jul 11:00
36Wed 09 Jul 12:00
37Wed 09 Jul 13:00
38Wed 09 Jul 14:00
39Wed 09 Jul 15:00
40Wed 09 Jul 16:00
41Wed 09 Jul 17:00
42Wed 09 Jul 18:00
43Wed 09 Jul 19:00
44Wed 09 Jul 20:00
45Wed 09 Jul 21:00
46Wed 09 Jul 22:00
47Wed 09 Jul 23:00
48Thu 10 Jul 00:00
49Thu 10 Jul 01:00
50Thu 10 Jul 02:00
51Thu 10 Jul 03:00
help
Download GIF
hover
Single-variable mode
You are now in the multi variable mode. Select all the variables of interest and they will be plotted side-by-side in a grid.
You are now in the multi variable mode. Select all the variables of interest and they will be plotted side-by-side in a grid.
URL of this map