AIFSThe selected time, variable and region is available for this model. ECMWF runs the Artificial Intelligence/Integrated Forecasting System (AIFS). The output of this AIFS experimental model is forecast with 6-hourly time steps out to 15 days initialised from the ECMWF operational analysis. Forecasts are produced four times per day (00/06/12/18UTC). The data are released 1 hour after the real-time. See more info here.
ECMWFThe selected time, variable and region is available for this model. The European Centre for Medium-Range Weather Forecasts (ECMWF) creates forecasts for the upcoming 15 days and is a global leader in forecast skill. However, it offers only a small number of parameters for free. The 00Z and 12Z runs are coming in twice daily between 6 and 7 UTC and 18 and 19 UTC.
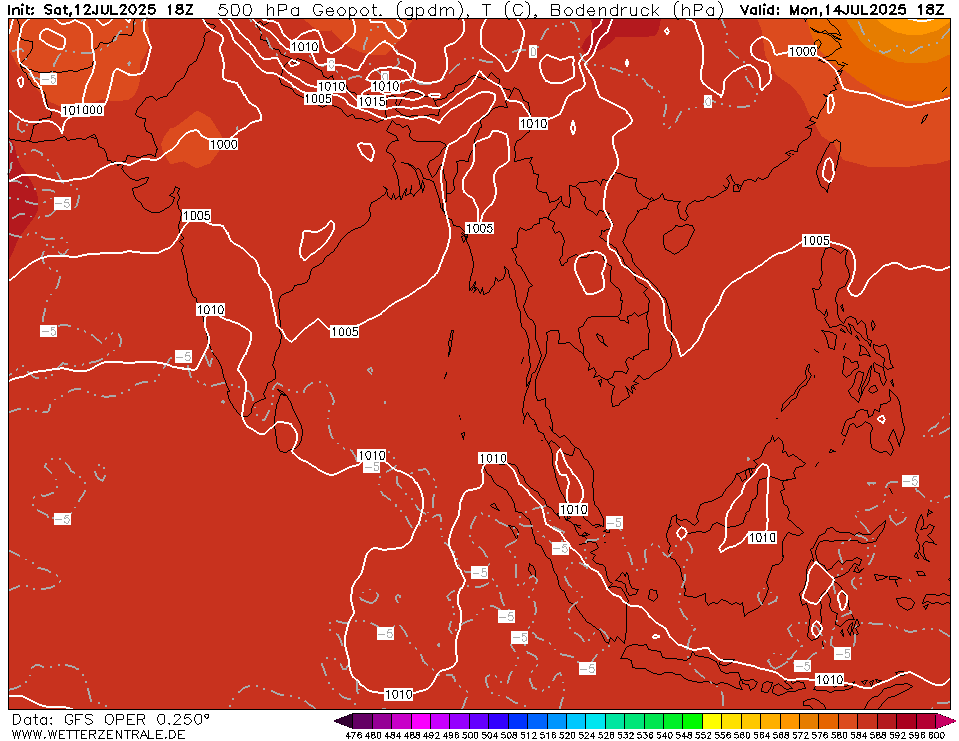
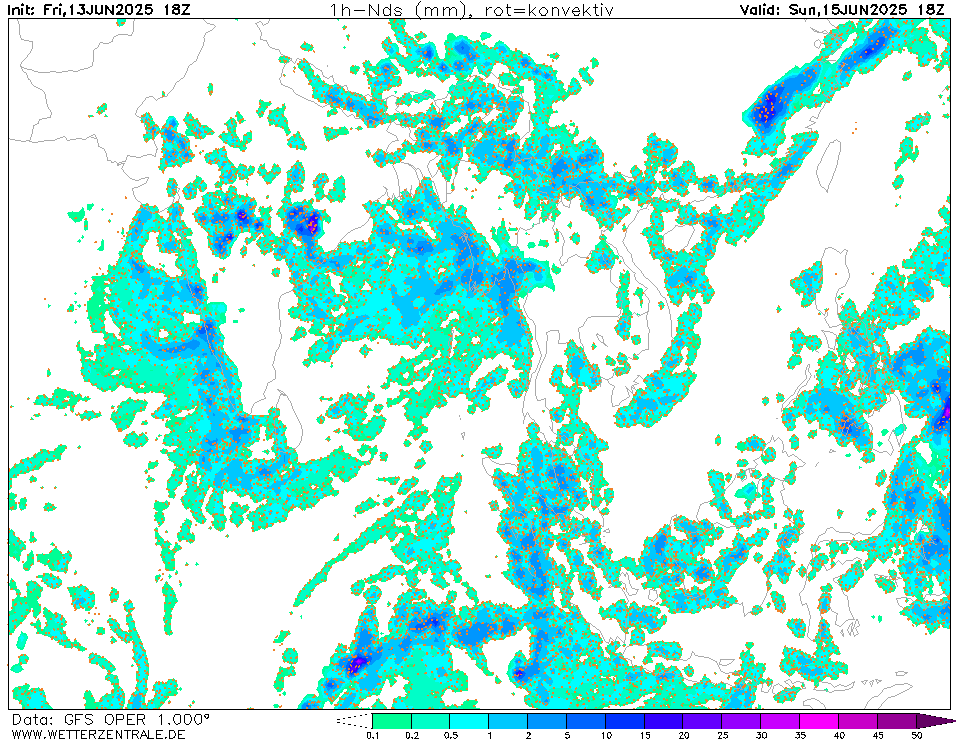
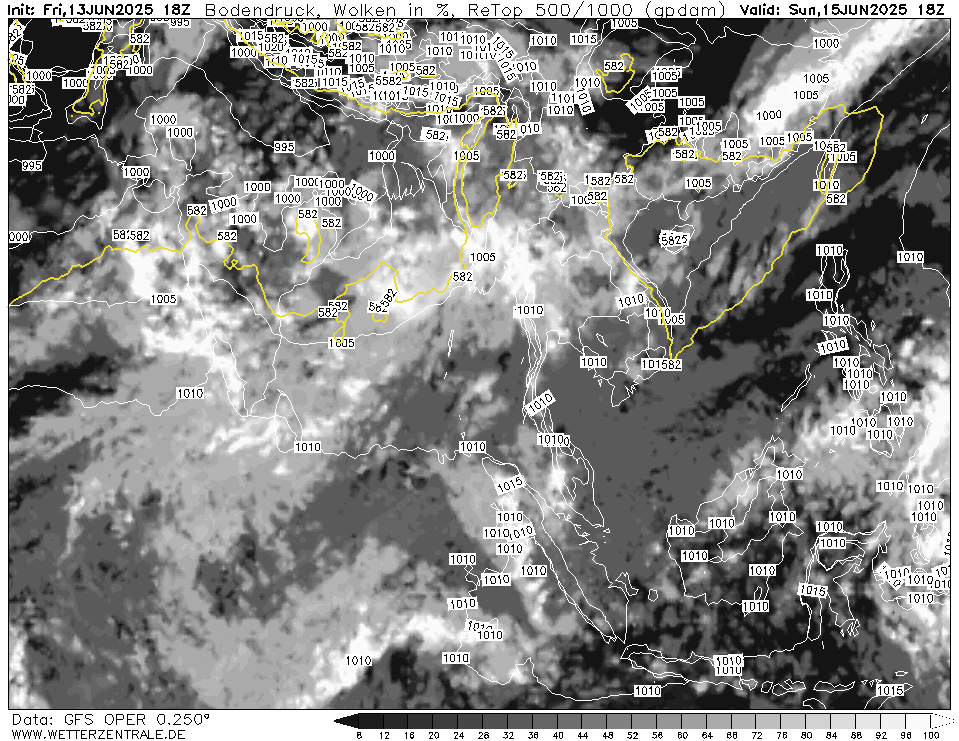
GFSCurrently selected. GFS is the global weather forecast model of the US weather service run at an internal resolution of 28 km. It offers a plethora of parameters for the next 15 days. Updated 4 times a day up to 384 hours ahead. The runs for the 0, 6, 12 and 18Z runs are usually coming in from 3:30, 9:30, 15:30 and 21:30 UTC, respectively.
GCGFSThe selected time, variable and region is available for this model. The GraphCast Global Forecast System (GraphCastGFS) is an experimental system set up by the National Centers for Environmental Prediction (NCEP) to produce medium range global forecasts. The horizontal resolution is a 0.25 degree latitude-longitude grid (about 28 km). The model runs 4 times a day at 00Z, 06Z, 12Z and 18Z cycles. The products are 6 hourly forecasts up to 10 days. See more info here.


3Fri 07 Jun 21:00
6Sat 08 Jun 00:00
9Sat 08 Jun 03:00
12Sat 08 Jun 06:00
15Sat 08 Jun 09:00
18Sat 08 Jun 12:00
21Sat 08 Jun 15:00
24Sat 08 Jun 18:00
27Sat 08 Jun 21:00
30Sun 09 Jun 00:00
33Sun 09 Jun 03:00
36Sun 09 Jun 06:00
39Sun 09 Jun 09:00
42Sun 09 Jun 12:00
45Sun 09 Jun 15:00
48Sun 09 Jun 18:00
51Sun 09 Jun 21:00
54Mon 10 Jun 00:00
57Mon 10 Jun 03:00
60Mon 10 Jun 06:00
63Mon 10 Jun 09:00
66Mon 10 Jun 12:00
help
Download GIF
hover
Single-variable mode
You are now in the multi variable mode. Select all the variables of interest and they will be plotted side-by-side in a grid.
You are now in the multi variable mode. Select all the variables of interest and they will be plotted side-by-side in a grid.
URL of this map